Colorshift is abandoned, it is replaced by Quaternions now.
But nevertheless...
According to QCD the next nine gluons work between the three colors in the baryons, like the proton and the neutron.


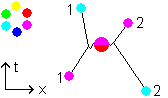 Fig.2
Fig.2
We have an antibaryon consisting of one magenta quark, one cyan quark and a yellow one. Regard the magenta and the cyan quark. The two quarks are glued together by a gluon that goes from the magenta to the cyan quark. It takes time for the gluon to move about. The gluon changes the color magenta of the emitting quark into cyan by shifting the color along the arc of the colorcircle. The magenta is shifted over an angle of -2/6 of a full turn. Minus sign indicates clockwise direction, plus sign indicates anticlockwise direction. The gluon itself then consists of the opposite shift +2/6 from cyan to magenta as being the shift that is removed from the quark. The gluon is denoted by the color of the emitting quark before gluon-emission (magenta) in the upper half of the gluon and the anticolor of the quark's end-state in the lower half. It is as if the gluon takes away the color of the emitting quark in its upper half and then a color-anticolor-pair of its destination appears, a so-called correlated pair of particles, a correlated pair of colors cyan-red. The anticolor cyan is left behind in return for the anticolor magenta that is taken away and the color red is dragged along in the lower half of the gluon. Mind there are two destinations. One destination is the color cyan in which the emitting quark ends up. Another destination is the cyan quark that is the gluon's goal.
Then the receiving cyan quark absorbs the gluon, it absorbs the shift of +2/6 and changes into magenta. The effect is an exchange of colors between the quarks. As if the magenta goes from quark 1 to quark 2 and the cyan going from quark 2 to quark 1. As if the anticolor goes backwards in time. A more time-symmetric representation of the last diagram is:
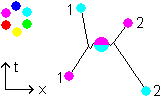 Fig.3
Fig.3
Is  different from
  ? (For the moment we keep on using here the time-symmetric view of the last picture, although this isn't the conventional view.)
occurs in figure 3. While occurs in
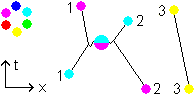 Fig.4
Fig.4
When Fig.4 is looked upon from behind, making one sees the mirror image, this reaction looks like
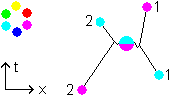 Fig.5
Fig.5
Which basically differs from Fig.4 in time order only. If this picture is viewed as being Fig.4, the gluon now goes from particle 2 to particle 1:
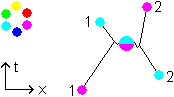 Fig.6
Fig.6
So and differ in time order of their start and finish points.
When calculating the contribution of this diagram in QCD, they take the sum of the wavefunction of this diagram for all possible points in spacetime where the beginning of the gluons path can occur and all possible points in spacetime where the end of the gluons path can occur. The cases in fig.3 and fig.6 are automatically included then. So for calculation in QCD there is little difference between and . But they do differ in time order.
Normal and time-symmetric representation
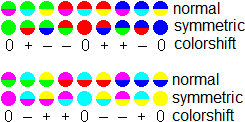
Translating from normal representation to time-symmetric representation: the upper half of the gluon is kept the same, the lower half is replaced by its anticolor.
![]()
The last line gives the color-shift represented by the gluon. The quark that has emitted this gluon experiences a shift of color that is given by the opposite. The +2/6 m-to-c gluon (just another gluon-notation) makes the magenta quark to shift over -2/6 to cyan.